From LiDAR point cloud to 3D model: digitally map, measure and compare industrial plants. The ELIOS 3 creates digital twins in confined spaces – tanks, boilers, silos and chimneys – where terrestrial laser scanners cannot go.
A digital twin is a three-dimensional digital image of a physical plant. In industrial inspection this means: a 3D model of your tank, boiler, chimney or silo – centimetre-accurate, colour-textured and with all findings georeferenced.
Why is this relevant?
Previously an inspection ended with a PDF report: text descriptions, a few photos, perhaps a sketch with position information. If you read the report a year later you have to reconstruct what was meant.
A digital twin changes this fundamentally: every finding has an exact 3D position, the model is navigable and measurable, and two models from different years can be overlaid.
The ELIOS 3 is the tool that creates these digital twins in confined spaces – where terrestrial laser scanners cannot go.
The Ouster OS0-128 LiDAR sensor sends 128 laser beams – 1.31 million points per second. Each point contains distance information (accuracy in the centimetre range). During the flight a growing 3D point cloud is created.
The FlyAware™ Engine registers all points in a consistent coordinate system. The result: a connected point cloud – even with multiple flights through different areas.
The 4K camera images are automatically projected onto the LiDAR point cloud. Every 3D point receives its real colour. Result: a photorealistic 3D model with recognisable surfaces, corrosion and deposits.
In Inspector 5 the point cloud is cleaned, optimised and prepared for evaluation. Mark findings, carry out measurements and create cross-sections.
Digital analysis – processing LiDAR point clouds and creating digital twins.
Until 2024, LiDAR point clouds were grey or coloured by intensity. Technically precise, but difficult for non-experts to interpret. Where exactly is the corrosion in this grey point cloud?
Colorization changes this: The 4K camera images of the ELIOS 3 are automatically projected onto every individual 3D point. The result is a photorealistic 3D model – you see the actual colours of the surface in 3D space.
Practical example: A tank roof with several corrosion spots. In the grey point cloud: barely recognisable. In the coloured model: the rust spots are immediately obvious, with exact position and area.
Interior completely in 3D: wall, floor, roof. Corrosion localised, coating condition documented. Geometry comparison on repeat inspection.
3D model of all heating surfaces, baffles, internals. Thermography overlay shows hotspots. Exact planning of refractory repairs.
Complete 3D model from base to crown. Cracks and spalling measurable. Wear progression visible over years.
Volumetrics: quantify build-ups and hangups. Calculate actual usable space.
3D model for class survey: frames, floor girders, coating condition – traceable and reproducible.
3D profile of channel cross-section: deformation, offset, crack widths – all measurable in the digital twin.
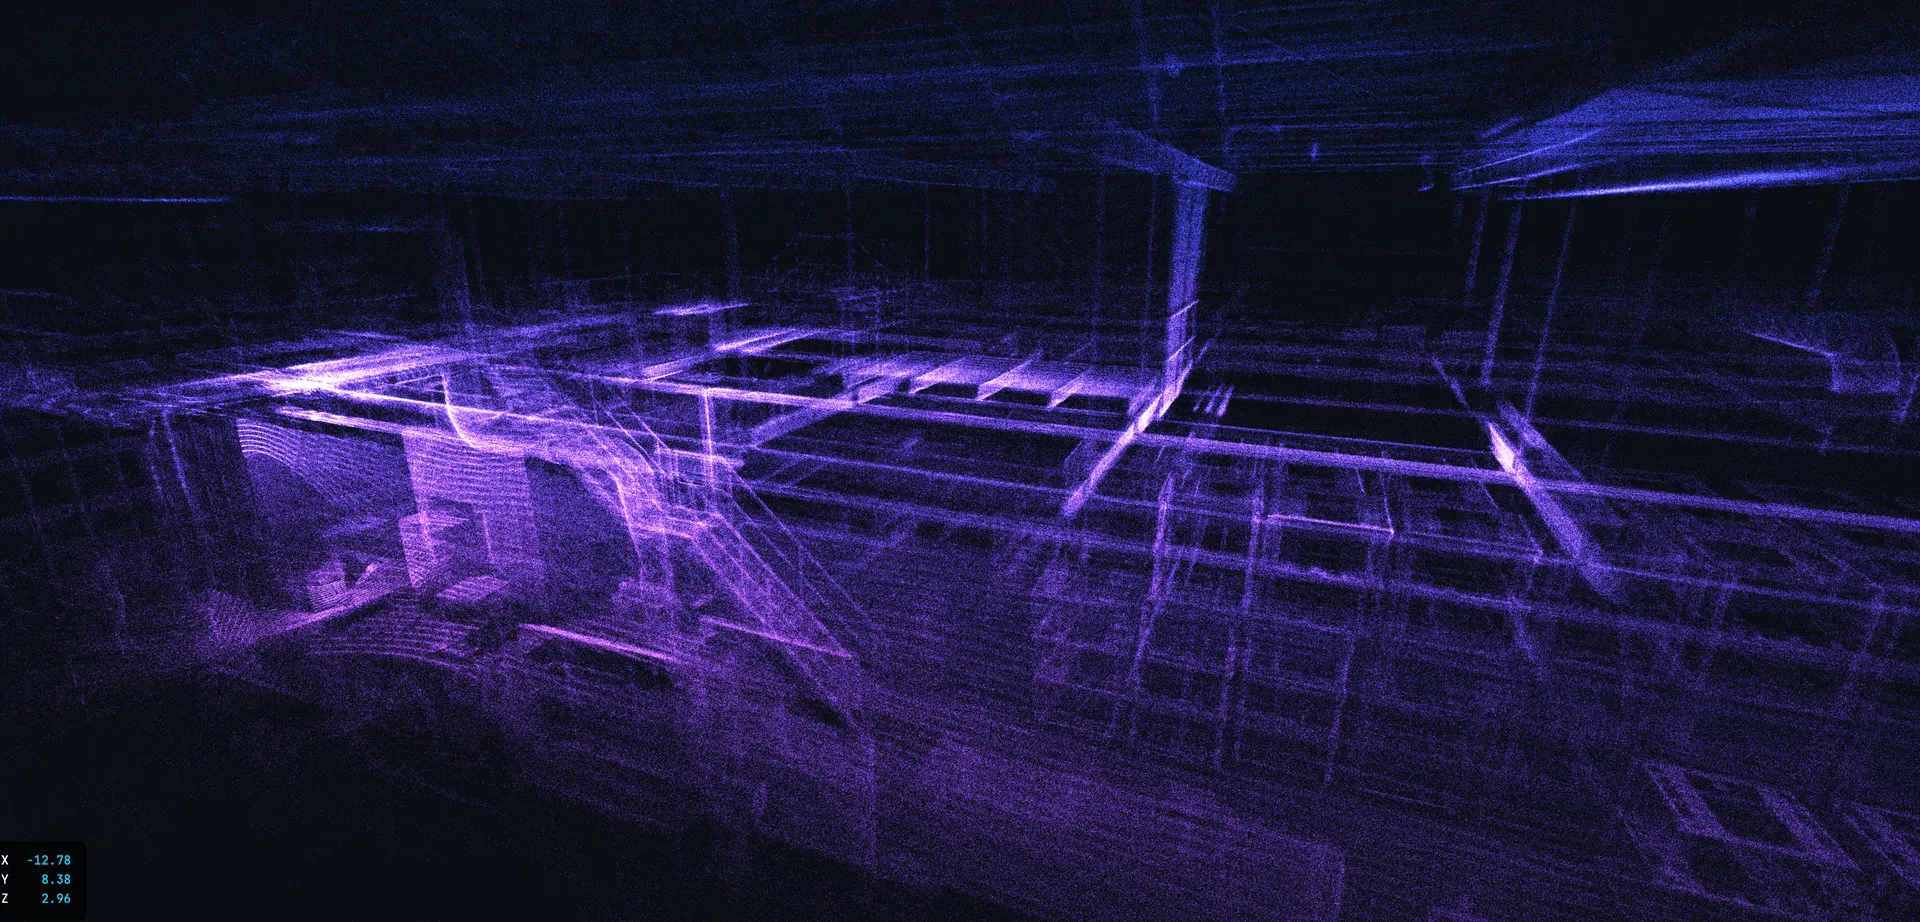
Isometric LiDAR point cloud – the geometric basis for digital twins.
Software: Flyability Cloud (Inspector 5) – post-processing, visualisation, measurement, export. Compatible with CloudCompare, AutoCAD, Revit, Navisworks, Cyclone 3DR and other 3D/BIM platforms.
Practical tip: For maximum point cloud quality we recommend slow, systematic flight patterns with overlap. The FlyAware live map shows the pilot in real time which areas are already sufficiently covered.
A digital twin from drone data is impressive – but it has limits:
1. Not a CAD model in the classical sense: The point cloud is a geometrically exact image of reality – but not a parametric CAD model. Conversion to a BIM model requires additional effort (mesh creation, object recognition). We deliver the point cloud – BIM modelling is handled by your planning office or CAD service provider.
2. Accuracy vs. terrestrial laser scanner: A stationary terrestrial laser scanner (e.g. FARO) is more precise at individual standpoints (±1–2 mm). The ELIOS 3 is in the centimetre range – but it reaches areas inaccessible to terrestrial scanners (over internals, behind baffles, in narrow shafts).
3. Drift with very large structures: With extremely long flights in large spaces, the SLAM algorithm can drift minimally. In practice: for the vast majority of industrial confined spaces accuracy is more than sufficient.
4. No wall thickness: LiDAR measures the surface – not wall thickness. For absolute wall thickness values UT remains the method of choice. LiDAR can however measure geometry changes between two time points and thus indirectly indicate material removal.
| Criterion | ELIOS 3 (LiDAR) | Terrestrial Laser Scanner | Photogrammetry |
|---|---|---|---|
| Precision | Centimetre range | ±1–2 mm | cm range |
| Confined space access | Yes (flies through manhole) | No (must be carried in) | Limited (needs access + light) |
| Darkness | Yes (active laser) | Yes (active laser) | No (needs light) |
| Coloured 3D model | Yes (Colorization) | Yes | Yes (natively coloured) |
| Human entry required | No | Yes | Yes |
| CAD/BIM export | Yes (.las, .e57) | Yes (.las, .e57, .rcp) | Limited (post-processing) |
| Ideal use area | Confined spaces, interiors | Freely accessible areas | Textured exterior surfaces |
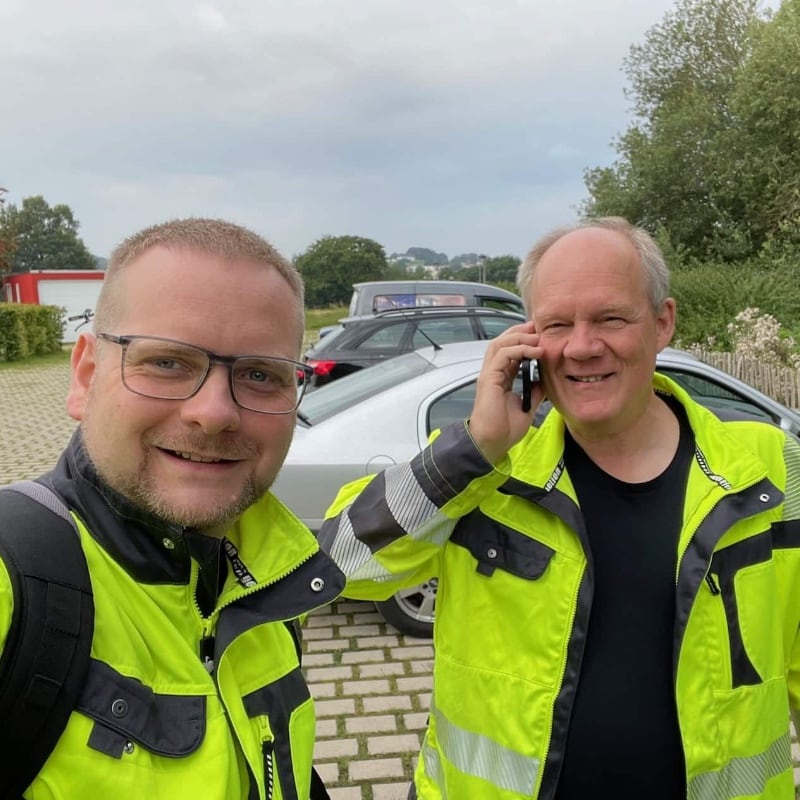
Dipl.-Ing. Karsten Lehrke and Christian Engelke – your direct contacts for digital twin and LiDAR projects.
We assess whether a LiDAR-based digital twin makes sense for your plant. Send us your requirements – we respond with a feasibility assessment and a quote.
Flyability Cloud (Inspector 5) is browser-based and requires no installation. For further analysis and CAD integration you can open .las/.e57 files in common software: CloudCompare (free), AutoCAD, Revit, Cyclone 3DR, Navisworks and many others.
Depends on the inspection scope. A typical tank inspection generates LiDAR data in the range of 500 MB to 5 GB. With colorization and video it can be 10–50 GB. We deliver the data on hard drive or via secure cloud download.
Yes, via .las/.e57 export. The point cloud can be imported into any common BIM system. The actual modelling (mesh, objects) requires additional CAD effort – we deliver the geometric foundation.
Main difference: the ELIOS 3 reaches areas inaccessible to terrestrial scanners (over internals, in narrow shafts, behind baffles). A stationary scanner is somewhat more precise at individual standpoints (±1–2 mm vs. centimetre range). In practice both complement each other: drone for the interior, terrestrial for the exterior area.
Raw data (point cloud) is available promptly after post-processing. Colorized point clouds take somewhat longer depending on data volume. Annotated models with all findings are delivered within the overall report. The exact timeline depends on scope and complexity of the deployment.
Colorization means the 4K camera images are automatically projected onto every 3D point in the LiDAR cloud. Before Colorization, point clouds were grey – geometrically exact but hard to interpret visually. With Colorization the surfaces are shown in their real colours: corrosion spots, coating conditions, deposits – all immediately visible in the 3D model. A paradigm shift for communication with experts, operators and insurers.
The digital twin is an excellent supplementary document: georeferenced finding documentation, measurable geometry, reproducible over time. For mandatory inspections per BetrSichV, the digital twin supplements the expert report – it is not a replacement. For insurance documentation the 3D model with findings provides significantly more evidence value than conventional photo documentation.
Interested in having a digital twin of your plant created? Fill out the form below and we’ll get back to you within 24 hours.